 Role: Lead Product Designer | Duration: 2 Years | Outcome: 30% YoY Growth
I led a 2-year strategic product transformation at CreditorWatch, turning a fragmented credit risk platform into a cohesive decisioning engine and sustaining 30% YoY revenue growth through a major price increase while laying the architectural groundwork for an Agentic AI strategy.
Context: the company and my role
CreditorWatch is an Australian B2B credit risk intelligence platform. Its core value proposition: help businesses monitor customers and debtors for financial risk (defaults, court actions, payment behaviour) before it hits the bottom line.
When I joined, the platform was at an inflection point. The core product (credit reports + alerting) represented ~70% of revenue, but it was showing cracks. Churn was rising, competitive pressure was mounting, and the internal strategy was doubling down on high-level portfolio reporting, an expensive bet I was brought in to pressure-test.
My role: Product Design Lead, owning end-to-end design strategy and delivery for the core credit risk workflow.
The business challenge
The company had been sustaining growth primarily through customer acquisition and annual price increases. But the model was beginning to strain:
- Churn was rising as customers questioned whether the value justified the cost
- Repositioning as a workflow tool has its challenges. A blend of competitive pressure and evolving segment needs made it hard for the market to see us as more than a data provider, despite our expanding capabilities
- The data model was at risk. Our competitive moat relied on data reciprocity: customers share trade data → the platform gets smarter → the data gets richer. Dormant users don’t share data. Disengagement was a structural threat, not just a UX problem.
The prevailing internal bet: build sophisticated portfolio reporting for power users, and the analytical value would anchor customers and drive deeper data integration. My job was to validate or challenge that assumption before the business committed to it.
My approach: diagnose before build
Rather than diving straight into solutioning, I ran a structured discovery program to establish a baseline and stress-test the hypothesis.
Behavioural data revealed a disengaged platform:
- One-off lookups and PDF downloads were at an all-time high, but all other features were disproportionately under-used
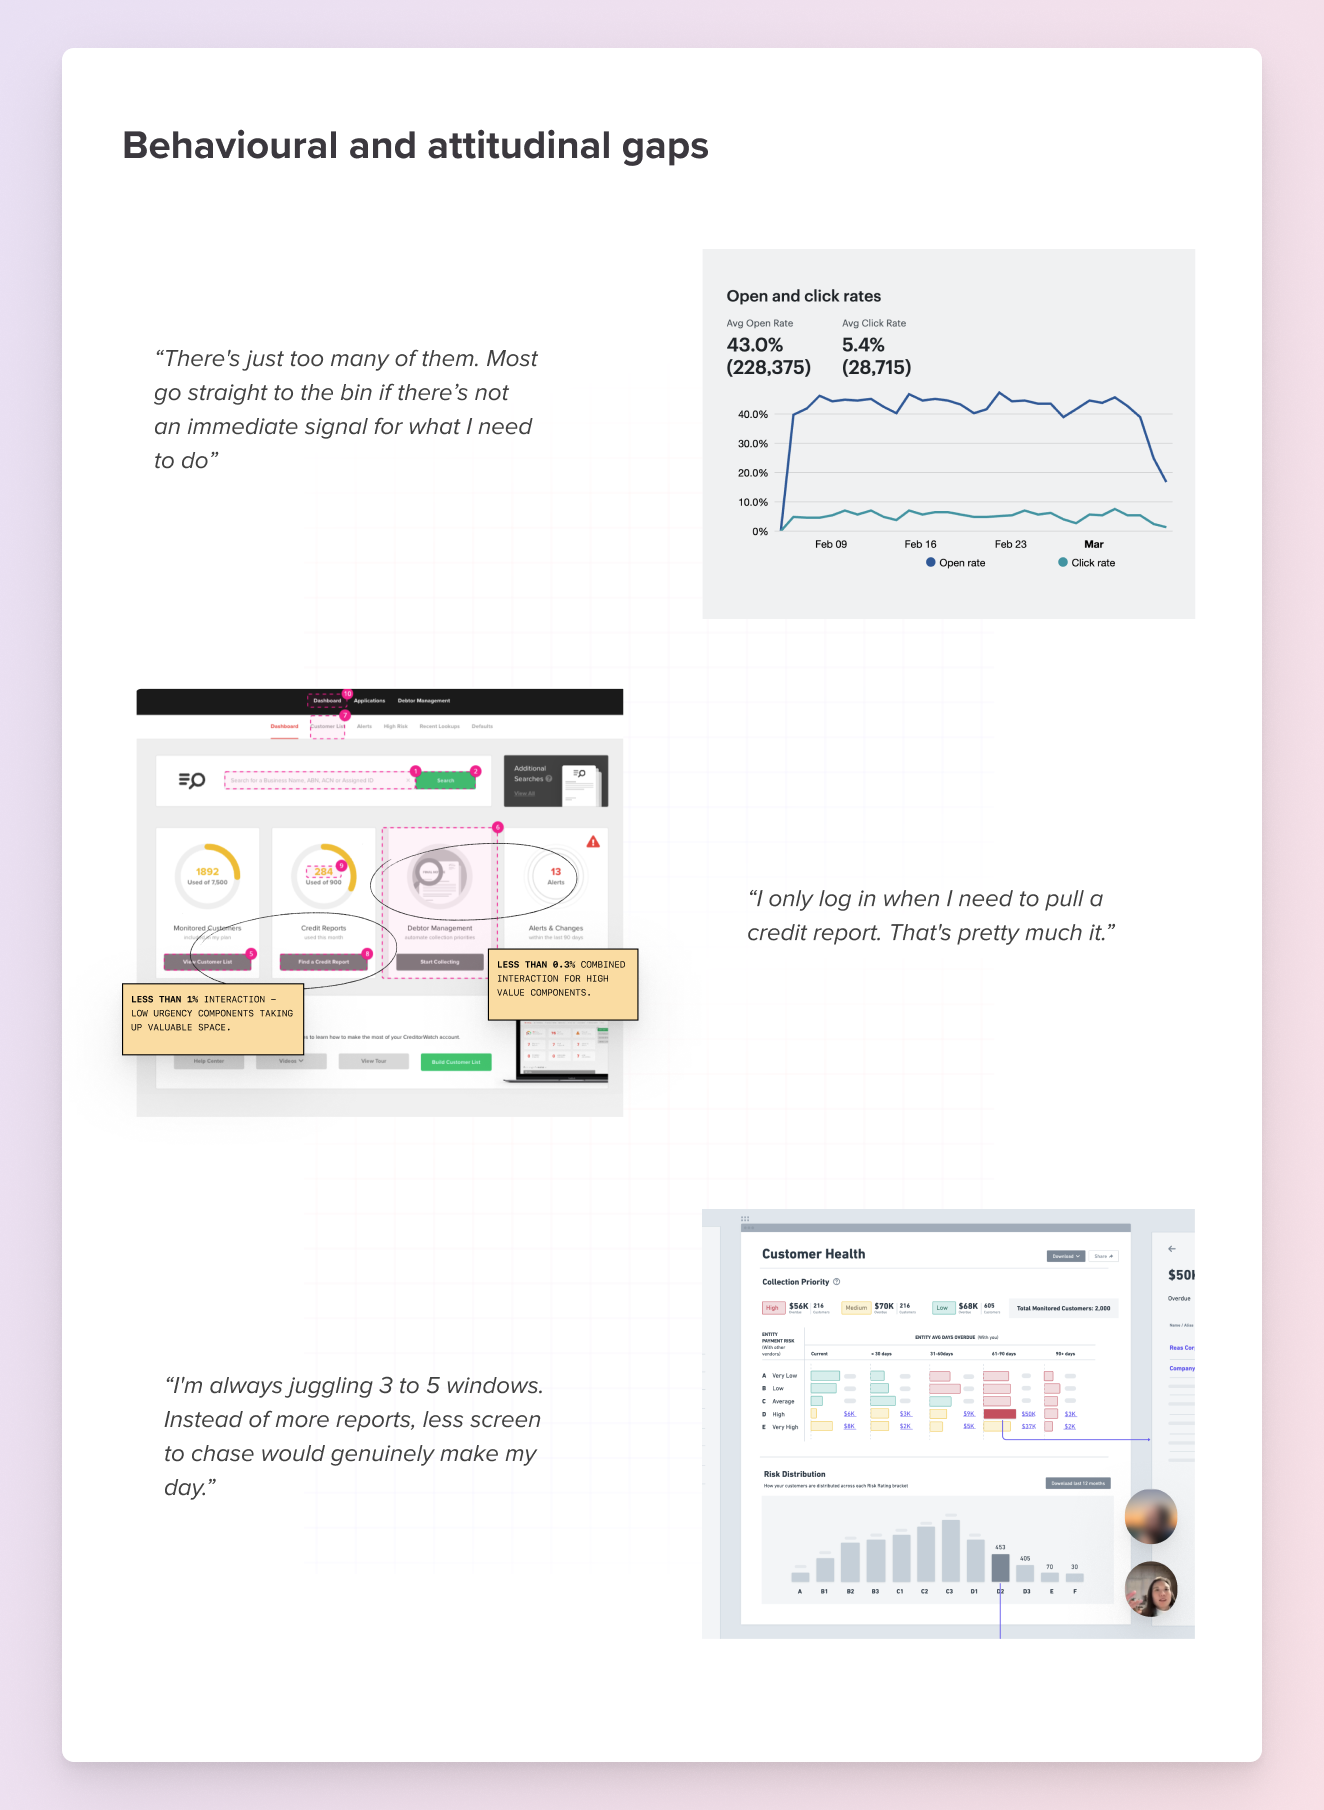
- Alert email open rates sat at 40%; click-through was just 4%, meaning the platform’s value rarely extended beyond the morning inbox
- Users were routinely exporting data to Excel to do their own analysis, treating the platform as a data vending machine, not a workflow tool
Attitudinal research surfaced the real frustration:
- “Too much noise, not enough signal”: users weren’t asking for fewer alerts. They were asking for clearer meaning.
- Lack of customisation: the platform defaulted to one-size-fits-all rather than adapting to each user’s risk appetite
- Low trust in data context: users could see that something had happened, but couldn’t tell why it mattered to them specifically
The critical insight shift: The business assumed users complained about too many alerts. The data showed they were complaining about a lack of synthesis. That reframe triggered a deeper look at our product strategy, and shaped the direction of our AI roadmap.
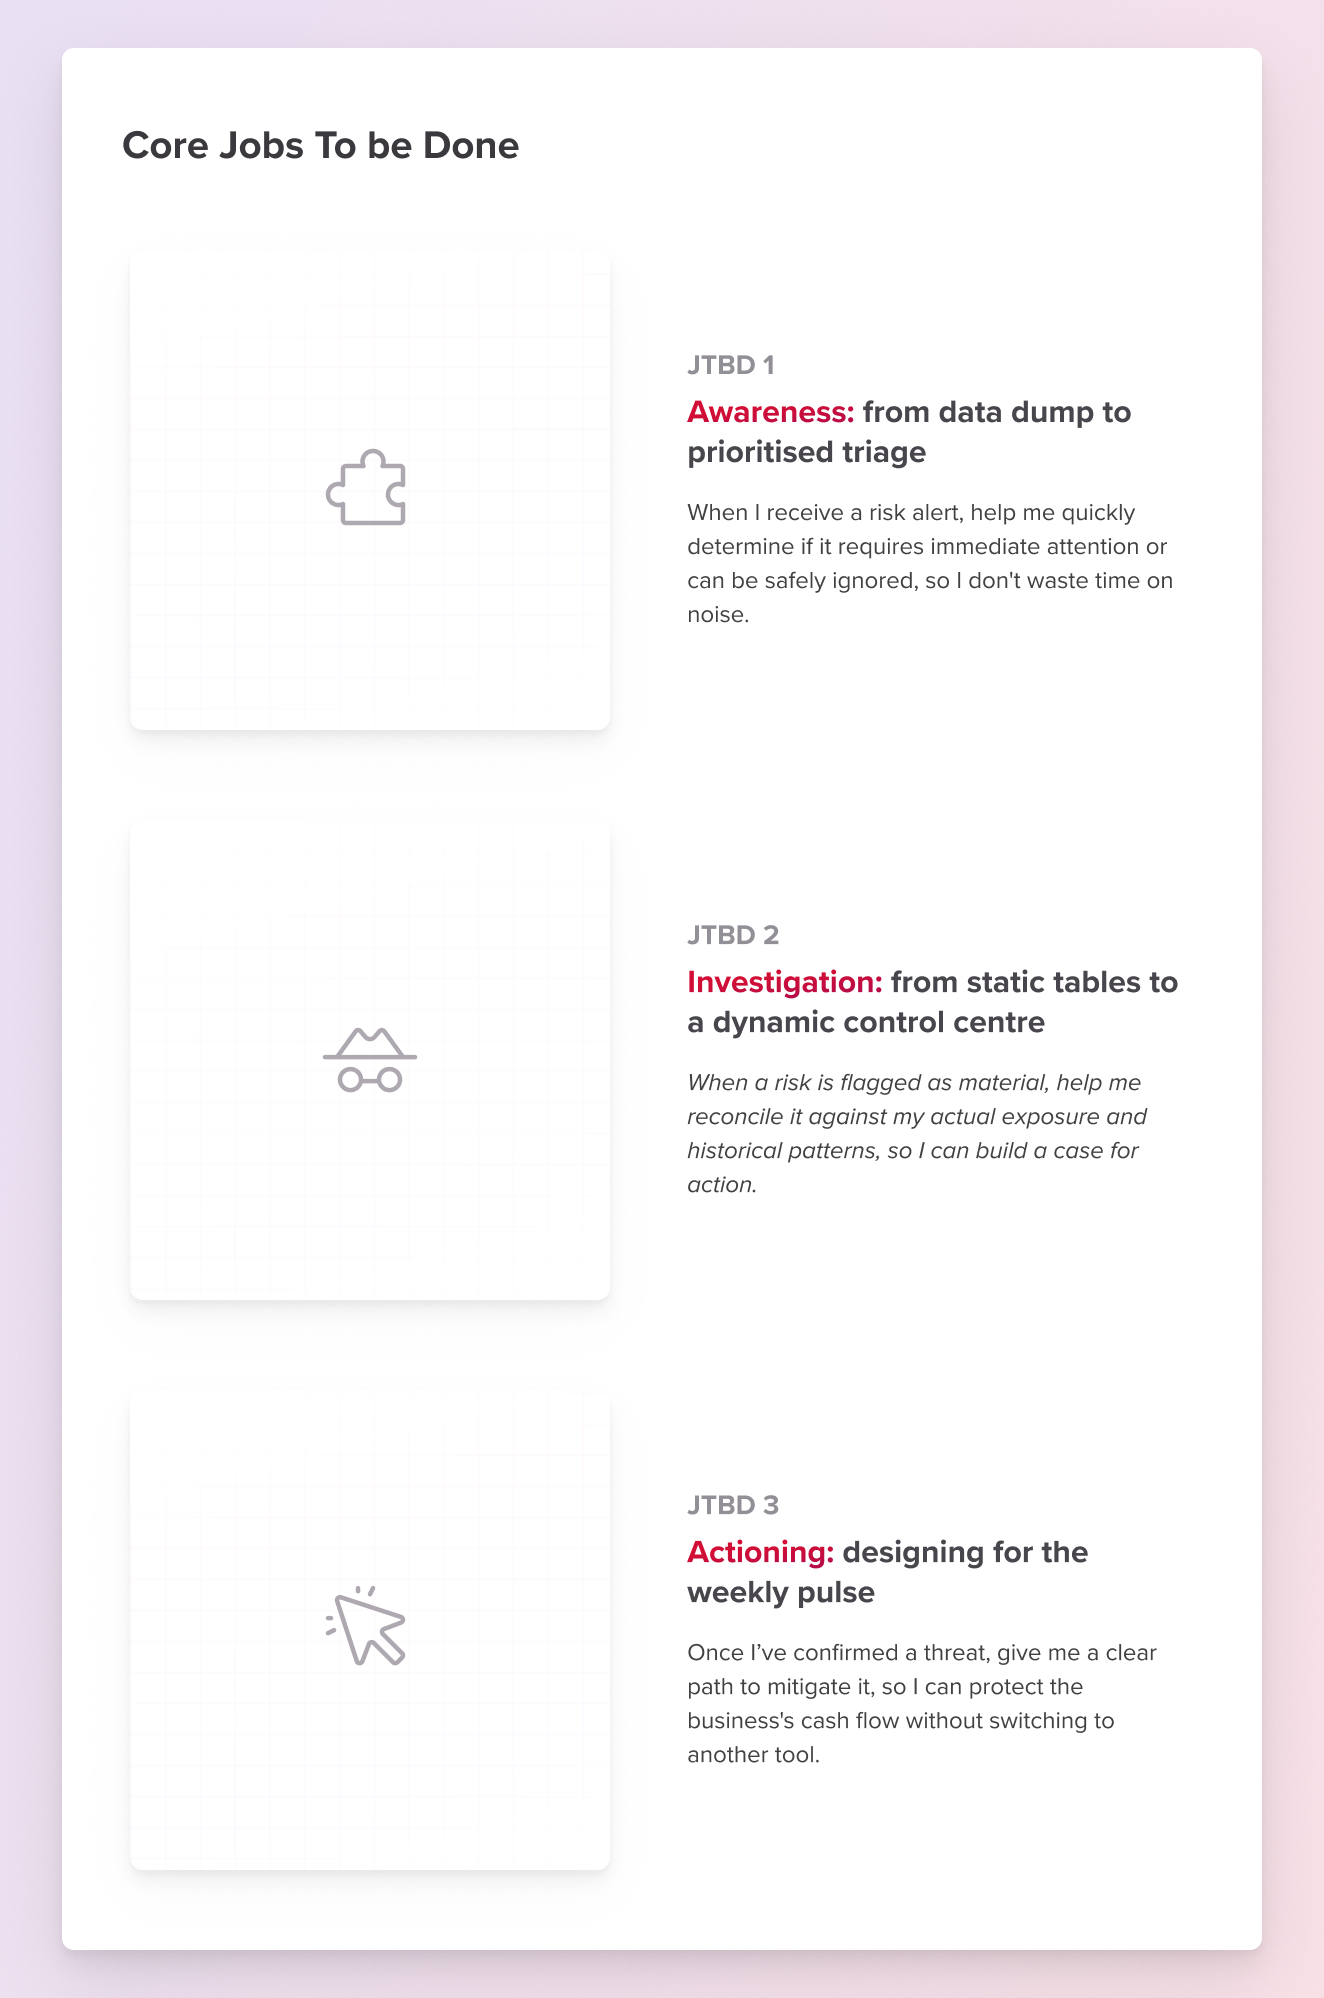
I mapped user behaviour against a three-stage mental model I identified as the core Jobs-to-be-Done:
- Awareness: Is this alert worth my attention?
- Investigation: How does this risk affect my actual exposure?
- Actioning: What do I do now, and can I do it here?
At every stage, the platform was letting users down. And the gap between where we were and where we needed to be wasn’t about more features. It was about closing fundamental workflow loops.
Strategic decision-making: the go/no-go framework
With clear evidence in hand, I presented the executive team with a structured assessment of the original strategy and three forward paths, forcing a reconciliation between our 30% growth targets and the reality of our technical debt.
Option 1: Bespoke Expansion (NO-GO) Double down on high-level strategic reporting for power users. I recommended against this: it would serve a vocal minority (~10% of users) while deepening the problems driving churn across the majority.
Option 2: 360° View (DEFERRED) Consolidate all platform signals into a single investigation interface. High-value in theory, but the technical complexity and user cognitive load made it the wrong bet for a manual UI. I flagged it as the right long-term answer, and it later became the blueprint for our AI strategy.
Option 3: Foundational Evolution (GO) Fix the Awareness and Investigation workflow first. Earn the right to richer data by proving the platform’s daily utility. Stabilise churn, justify the price increase, and create the data environment required for future intelligence.
This framing, presenting options as a Go/No-Go rather than a feature wish list, was a deliberate choice to move leadership out of “Feature Factory” thinking and into strategic sequencing. The business committed to Option 3.
Execution: rebuilding the risk lifecycle
Implementation was structured around the three-stage mental model, treating each as a distinct Job-to-be-Done.
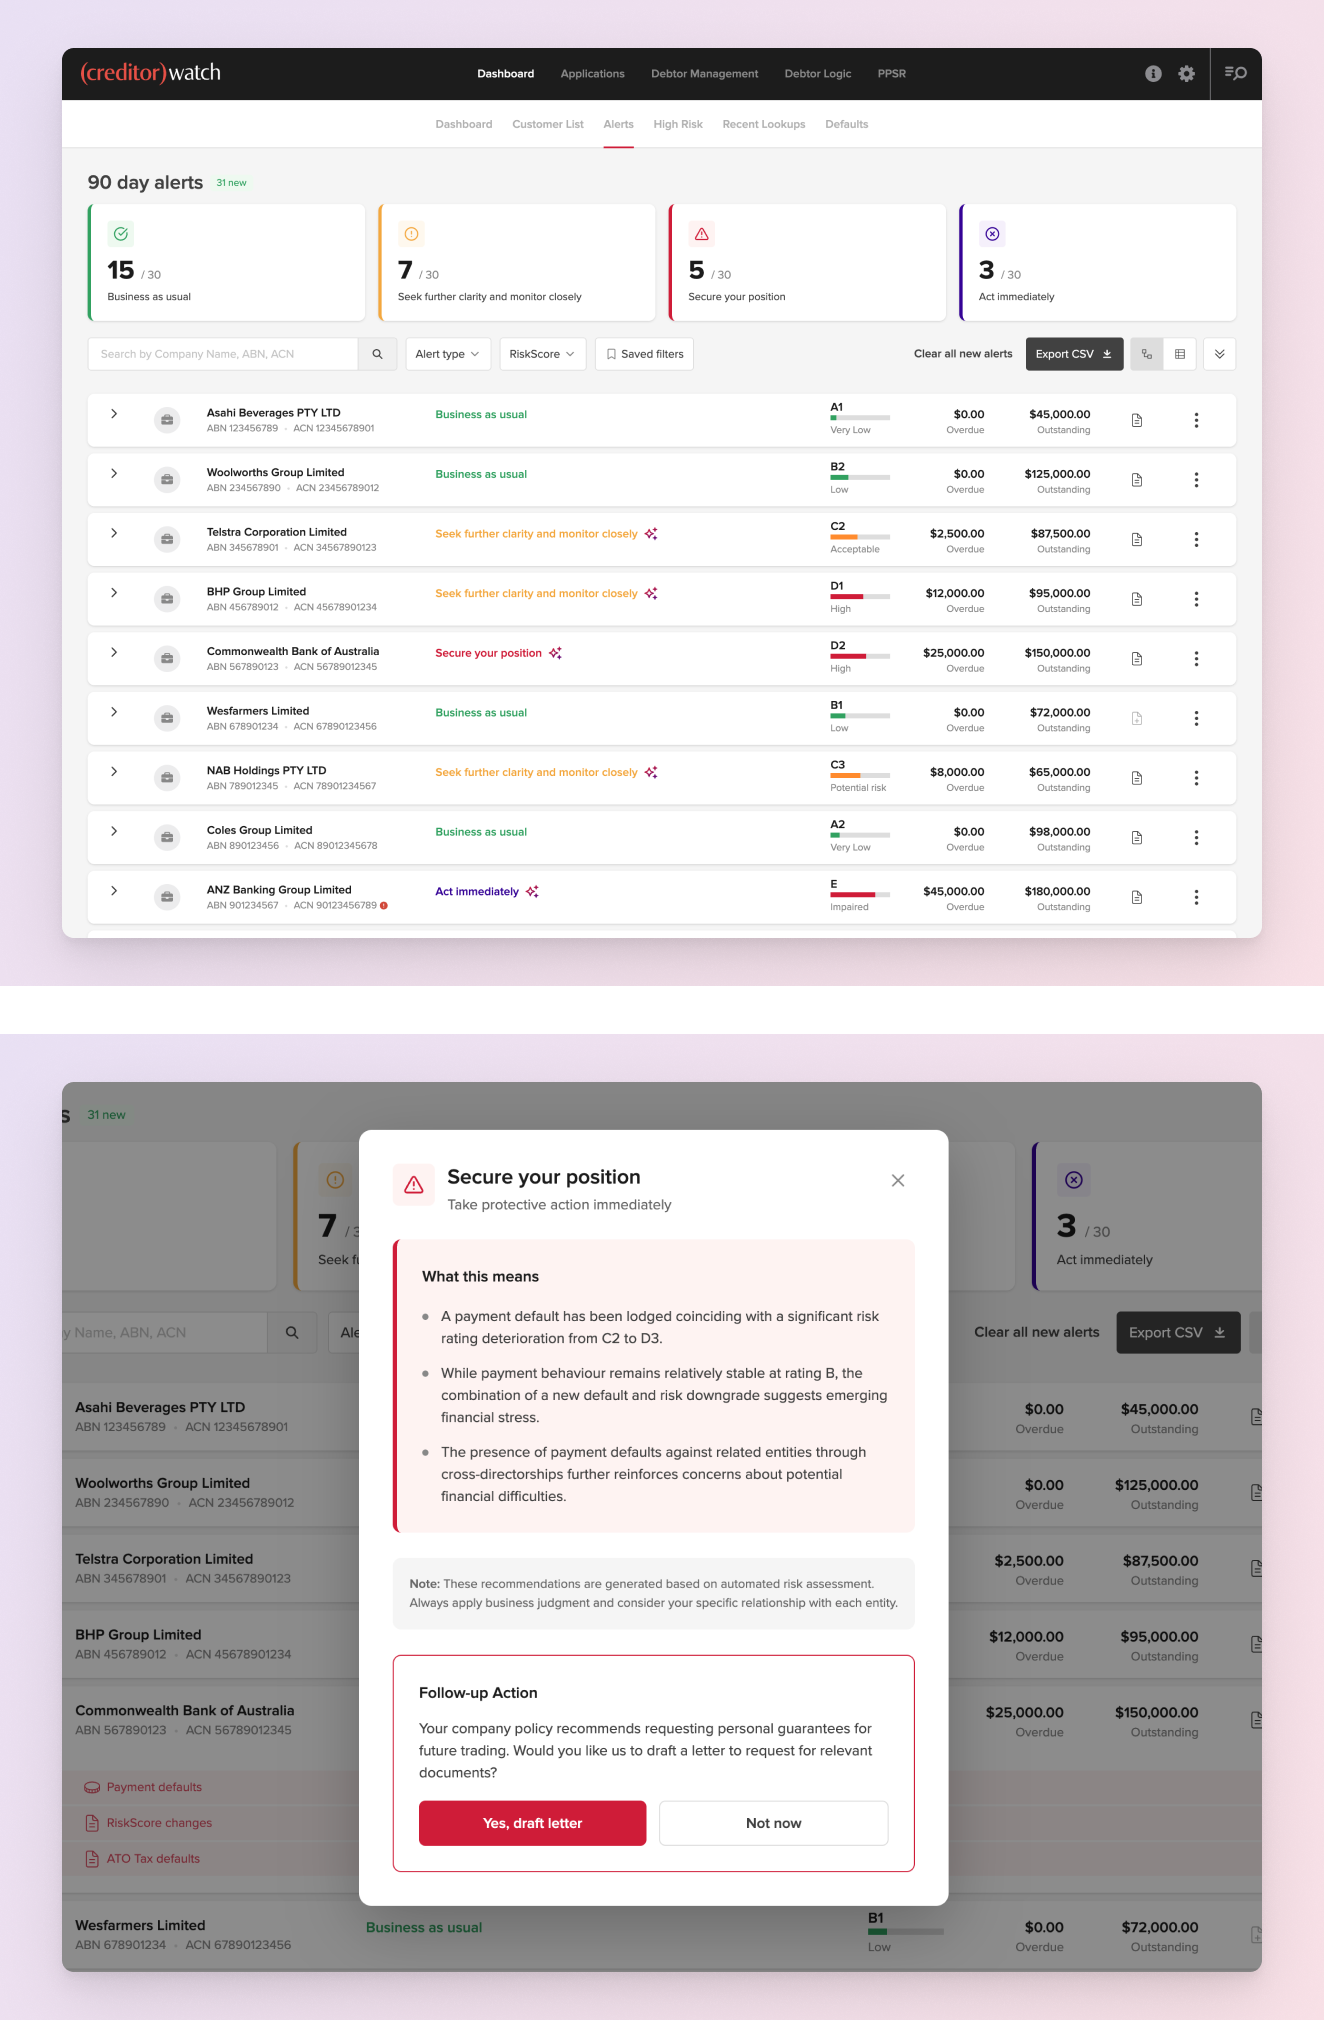
Pillar 1: Awareness, from data dump to prioritised triage
JTBD: “When I receive a risk alert, help me quickly determine if it requires immediate attention or can be safely ignored, so I don’t waste time on noise.”
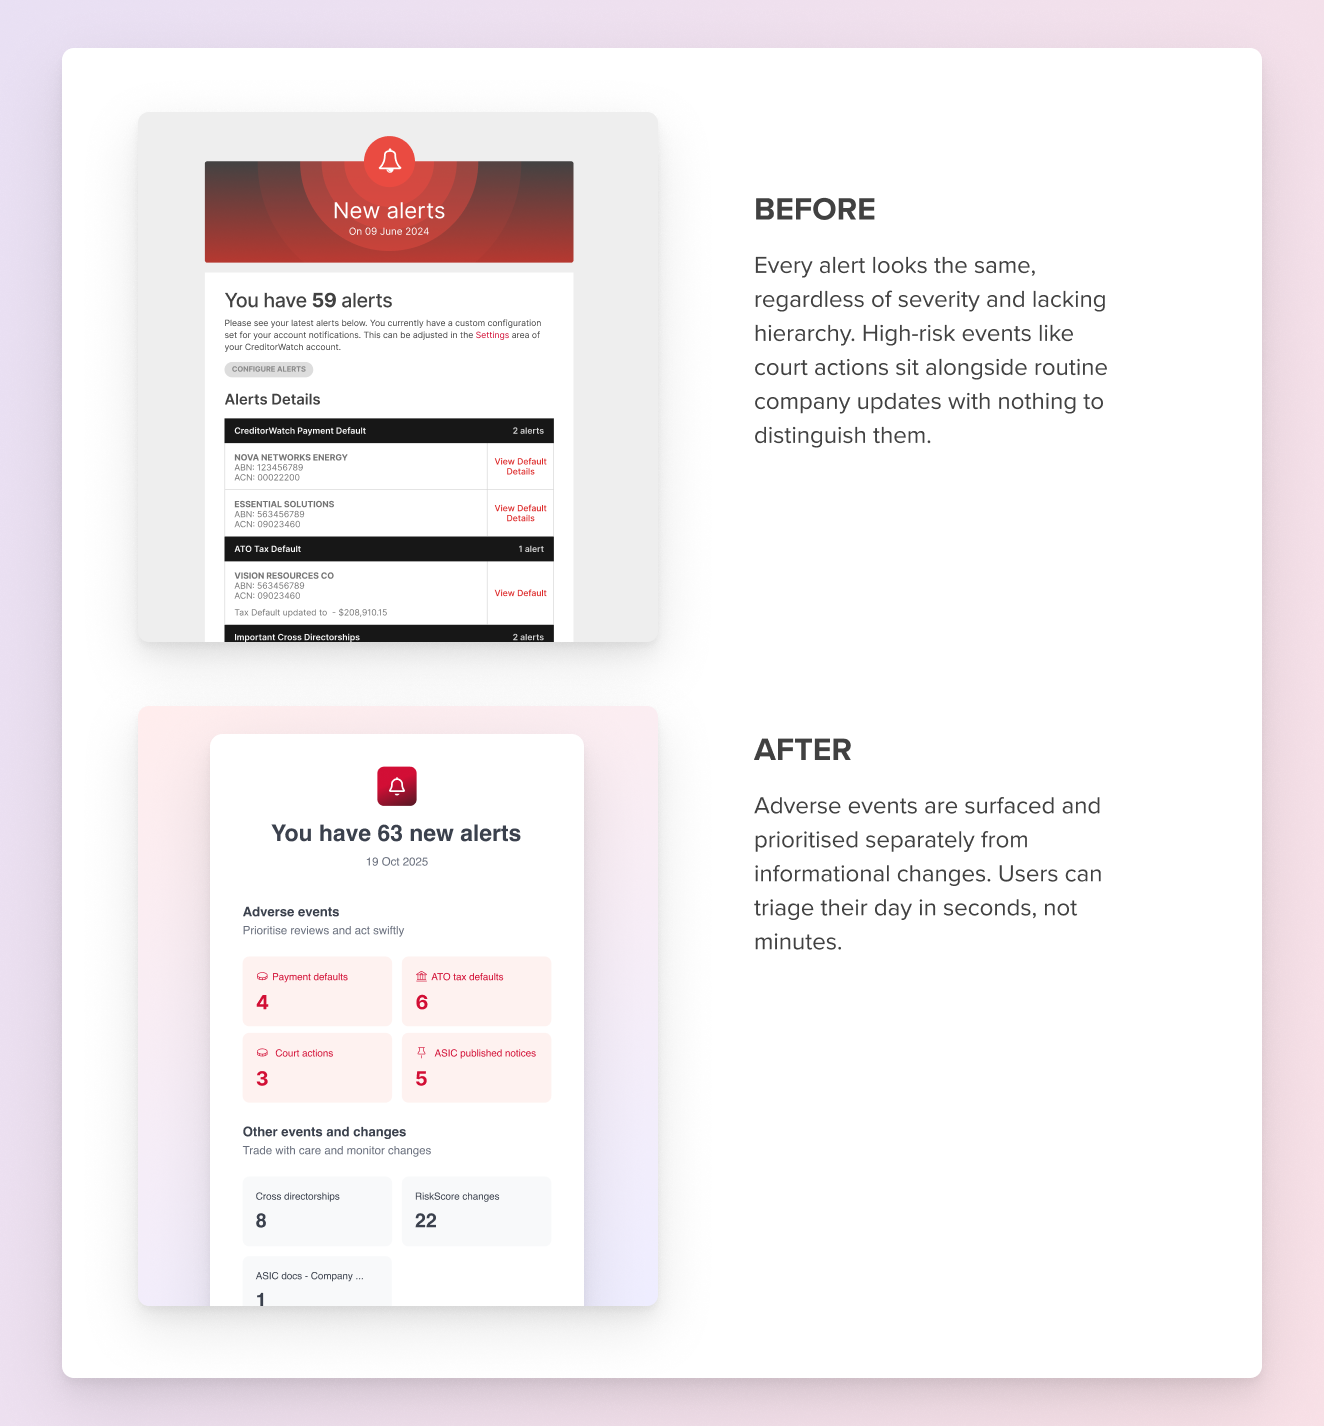
The problem: Alerts were context-blind. Users received events, not intelligence: high volume with no guidance on what actually mattered.
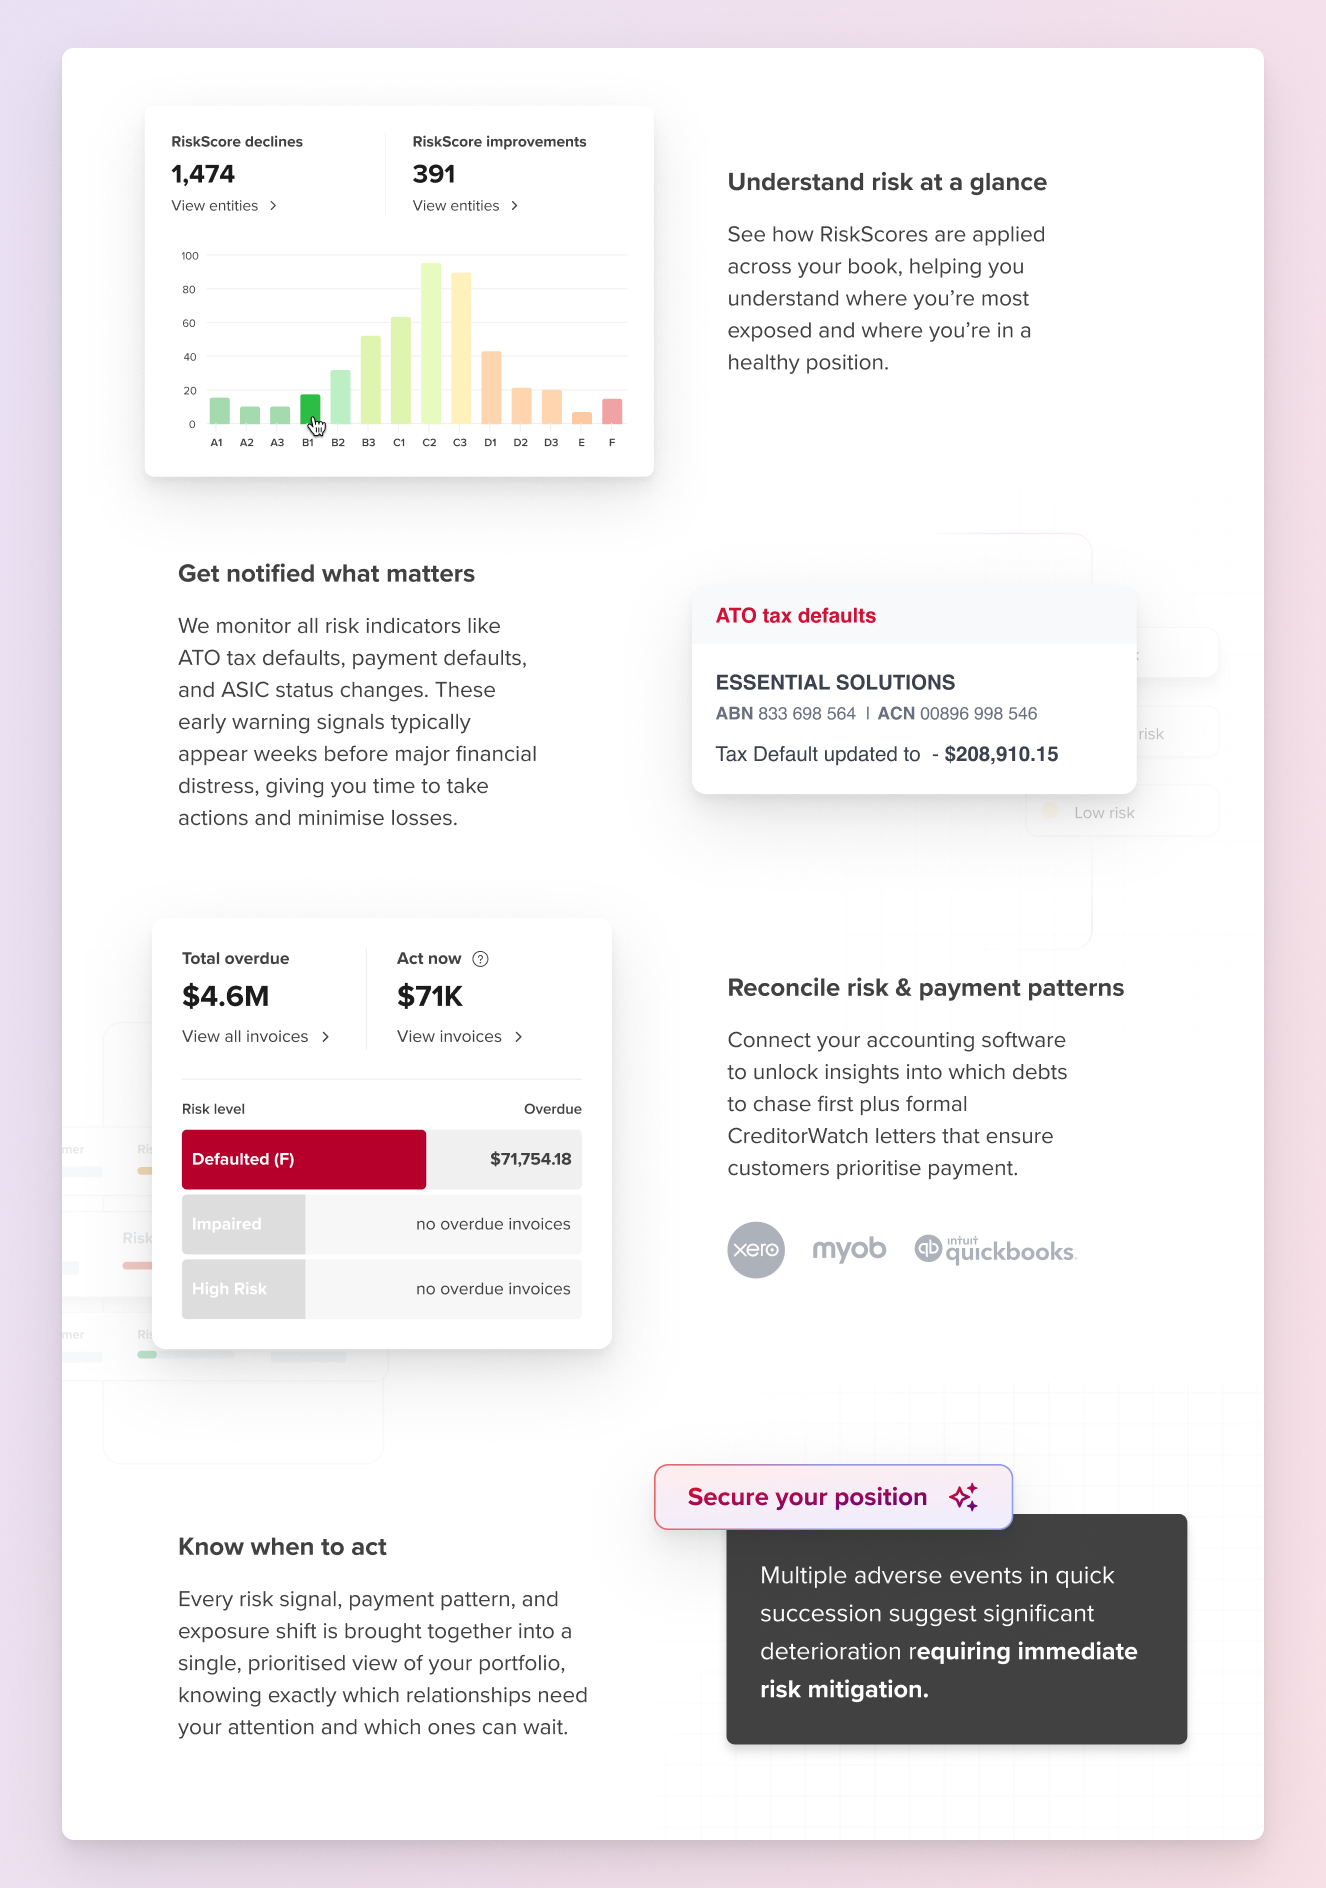
What we built: A redesigned notification system with clear visual risk categorisation (Adverse vs. Non-Adverse) and a personalisation layer allowing users to define their own risk appetite, specifying exactly which event types should trigger red flags for their unique business context.
The outcome: Users could identify their top priorities directly from their inbox. The cognitive load of starting the workday dropped significantly; daily platform engagement increased.
Pillar 2: Investigation, from static tables to a dynamic control centre
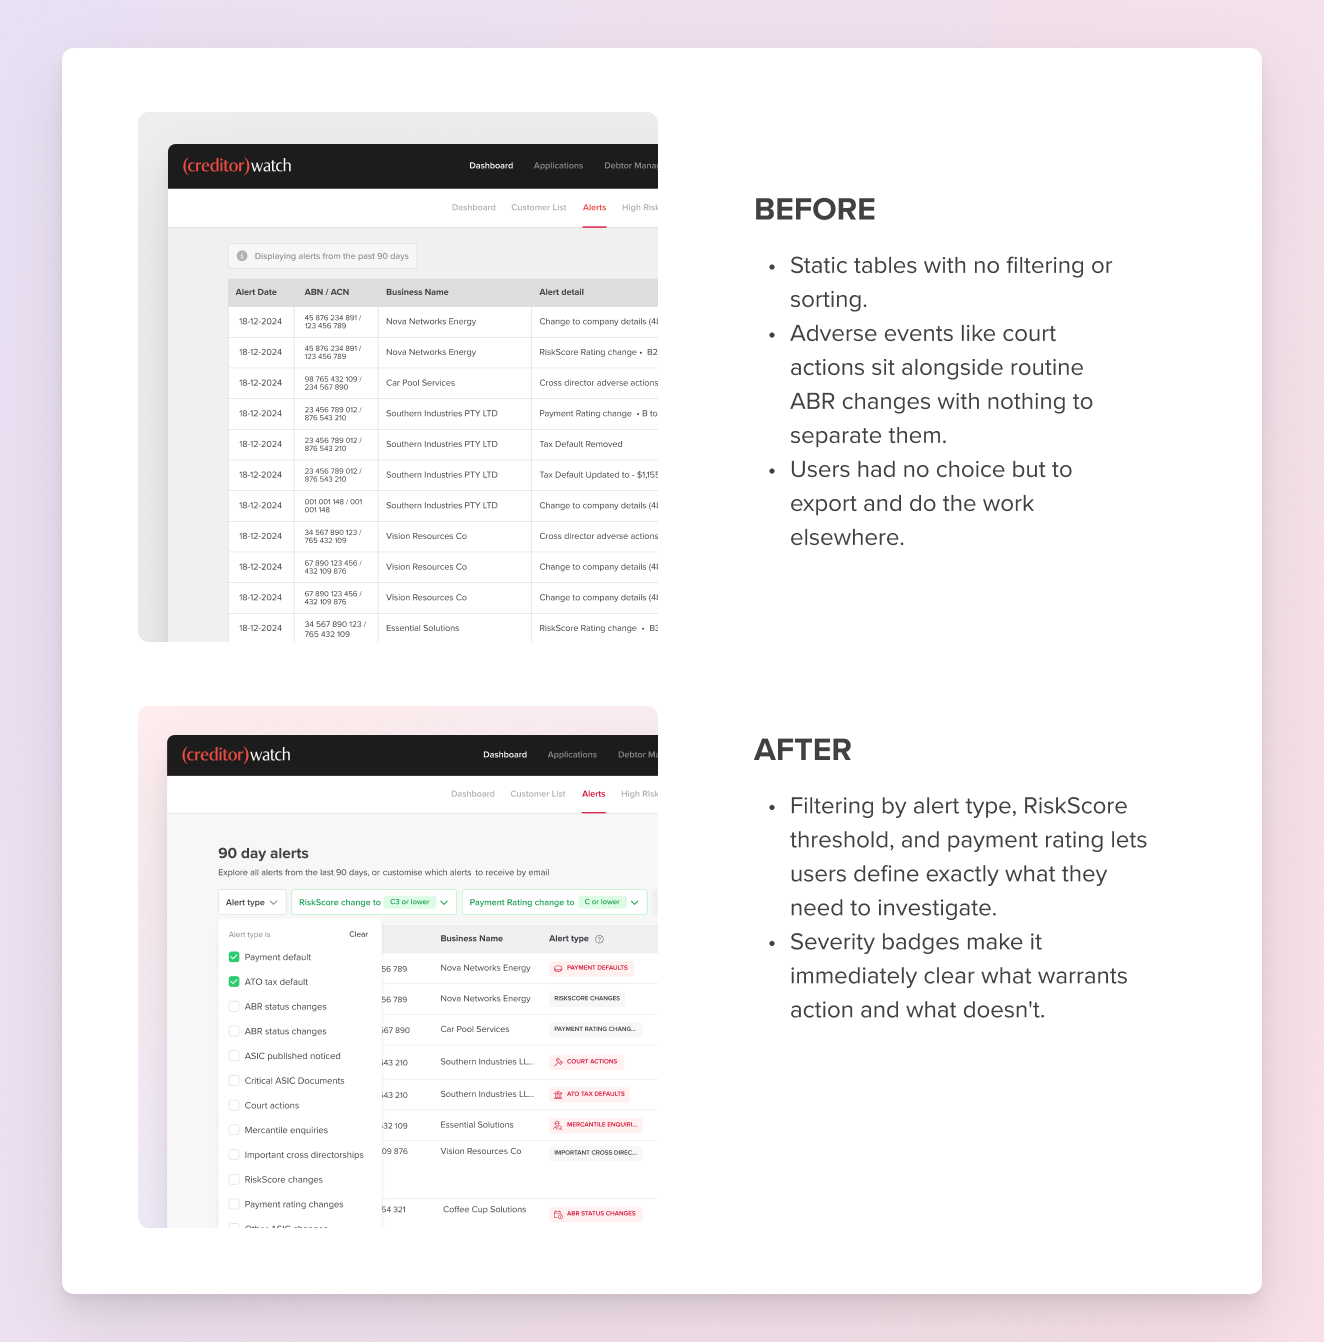
JTBD: “When a risk is flagged as material, help me reconcile it against my actual exposure and historical patterns, so I can build a case for action.”
The problem: Investigating a flagged risk meant navigating read-only tables with no filtering or sorting, then leaving the platform entirely to make sense of data in Excel. Every export was a broken engagement loop.
What we built: We introduced filtering and sorting to tables that had historically been static and hard to interrogate. This gave users the tools to drill down into their data in-platform, gradually shifting their reliance away from off-platform exports toward in-app discovery and exploration. Over time, we also enriched the tables with more relevant content, turning a fragmented investigation workflow into something more streamlined. Getting there required close collaboration with Engineering to navigate legacy constraints without a full rewrite.
The outcome: 15% increase in Weekly Active Users (WAU) within the first quarter of release. Users stopped exporting and started working inside the platform.
The AI unlock: By structuring the investigation logic, we created the data scaffold needed to support more agentic workflows, where structured triggers and enriched data can surface the patterns that users would previously have had to hunt for manually.
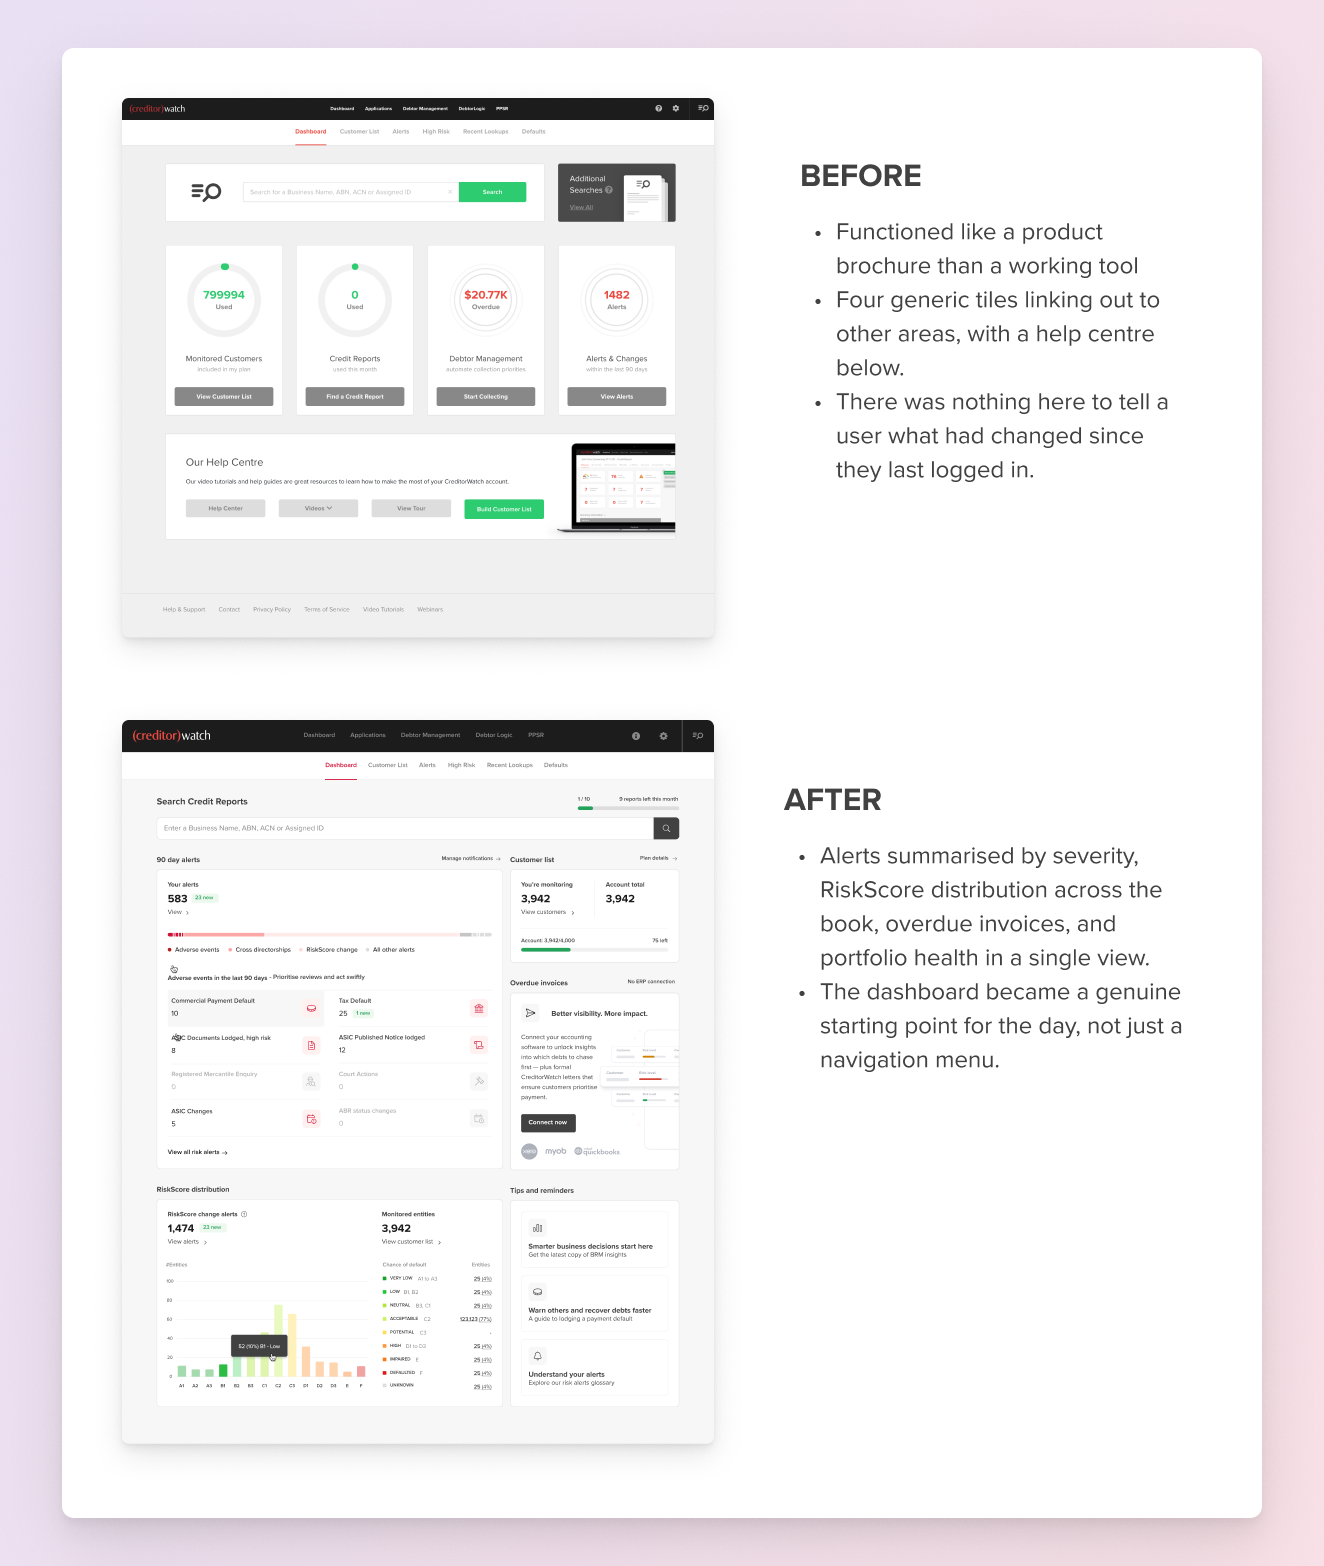
Pillar 3: Actioning, designing for the weekly pulse
JTBD: “Once I’ve confirmed a threat, give me a clear path to mitigate it, so I can protect the business’s cash flow without switching to another tool.”
The problem: Users would identify a risk on our platform, then leave to act on it elsewhere. A massive value leak at the last mile of the workflow.
The strategic pivot: Full ERP integration (Xero, NetSuite), the “perfect” solution, was too complex to execute at the pace the business needed. Rather than stall waiting for perfect, I pivoted to an interim strategy: make the platform a trusted companion rather than a command centre.
We redesigned the Dashboard as a Status Engine, surfacing “what’s changed since you last logged in” in a modular, snackable format designed for a weekly check-in rhythm rather than forced daily engagement. The goal was a platform that stayed useful in the background until it was needed, rather than demanding constant attention.
The outcome: Sustained engagement and a measurable drop in churn. Users described the platform as feeling more like a trusted partner than an exhausting tool.
Results
- 30% YoY revenue growth maintained through a major price increase, with positive customer feedback reflecting a gradual shift in perception and satisfaction across the user base
- 50%+ uplift in engagement across key product pages, making the platform more purposeful and sticky for active users, with gains progressively extending to less frequent users
- Product culture shift: from large, complex strategy builds to smaller iterative releases, testing and learning while keeping the long-term vision intact. Hygiene isn’t wasted effort; it’s how you win customers back
- AI readiness: the data scaffold built through this work directly enables the next evolution: smarter daily triggers, streamlined collaborative investigation, and one-click trade decisions
Key trade-offs
Deferred the “ideal” UX. Option 2 (the 360° View) was the most strategically complete solution, and I recommended against building it. The technical complexity and cognitive load made it the wrong bet in the moment. I stood by that call knowing it would be revisited once we’d earned the trust and data quality to do it properly. It later became our AI blueprint.
Accepted ERP independence. I made the deliberate call to stop designing CreditorWatch as an ERP replacement and instead position it as a high-fidelity companion. This was a difficult conversation with stakeholders who wanted platform monopoly, but aligning with user reality rather than fighting it was the right call for retention.
Manual actioning in the short term. We didn’t fully solve Actioning in this phase. We stabilised it. Focusing on bridging the gap from awareness to investigation delivered higher ROI faster and built the user trust needed to eventually earn the data that will power full automation.
Takeaways
Foundational UX is a commercial growth lever. In B2B SaaS, “boring” hygiene work, cleaner alerts, smarter tables, a more useful dashboard, often yields more ROI than new feature launches. Making that case requires translating UX friction into business impact, which is precisely the work I did here.
Research changes the conversation. The insight that killed Option 1 came directly from behavioural data and user interviews. Without that evidence, the business would have invested heavily in the wrong direction. Discovery isn’t overhead; it’s risk mitigation at the portfolio level.
Sequencing is strategy. The difference between Option 2 (deferred) and Option 3 (go) wasn’t that one was inherently better; it’s that Option 3 created the conditions for Option 2 to succeed later. Knowing what not to build, and in what order to build what you do prioritise, is where senior product thinking lives.
What comes next: AI readiness
The last two years were spent structuring the data, categorising risk events, mapping user appetite, and building contextual investigation logic. The platform is now more AI-ready than it has ever been.
The next chapter builds directly on each of the three pillars:
- Awareness → daily workflow driver: As our integration strategy matures, the platform becomes the place people start their day. Rather than reacting to a morning email, users open the platform knowing exactly what needs their attention and why.
- Investigation → collaborative task management: The fragmented investigation workflow evolves into a streamlined, cross-organisational tool, helping teams coordinate and work through multiple risk tasks together, based on what the awareness layer surfaces.
- Actioning → one-click decisions: We move from surfacing recommendations on what to do, to enabling one-click trade decisions and mitigative actions that connect directly to the customer-facing layer.
The groundwork for all of this was laid in the foundational work above.